

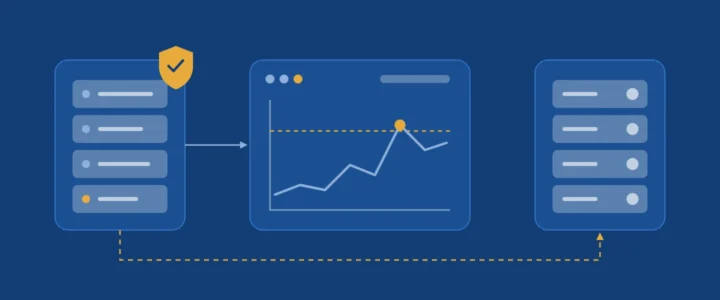
Hosting your own services on Linux servers installed on campus is a common choice for universities: control over data, predictable costs, independence from a single provider. But self-hosting also transfers a responsibility: knowing at any moment whether services are running, and being able to rebuild everything after a failure. This article presents the three pillars of a calm self-hosted infrastructure: a hardened server, monitoring that alerts you before your users do, and backups that can actually be restored.
Learning objectives
- apply the basic hardening measures for a Linux server;
- understand Prometheus’s monitoring model (scraping, alerting rules, Alertmanager) and the role of Grafana;
- state and apply the 3-2-1 backup rule;
- define RPO and RTO, and explain why RAID is not a backup.
1. Harden the server before it is useful
A server exposed on a network receives automated login attempts within minutes of going online. The following measures are not optional:
- regular security updates, automated for critical patches;
- key-based SSH login, with password authentication and direct root login disabled;
- a firewall that opens only the ports you need (for example 22, 80 and 443);
- a tool such as fail2ban, which temporarily bans addresses with repeated failed logins;
- least privilege: each service runs under its own user, without administrative rights.
2. Monitor: know before your users do
2.1 Metrics and logs
There are two sources of information. Metrics are numbers measured at regular intervals (CPU load, free memory, disk space, response time): they tell you that something is happening. Logs are text events: they tell you why. Good monitoring starts with metrics.
2.2 The Prometheus model
Prometheus works in pull mode: it periodically queries collection endpoints called exporters. For a Linux server, node_exporter exposes hundreds of system metrics on port 9100. The minimal configuration fits in a few lines:
# prometheus.yml
global:
  scrape_interval: 60s

scrape_configs:
  - job_name: node
    static_configs:
      - targets: ['10.0.0.12:9100', '10.0.0.13:9100']
2.3 Useful alerts
According to the Prometheus documentation, alerting has two parts: alerting rules evaluated by the Prometheus server send alerts to Alertmanager, which groups, inhibits and silences them, and sends notifications by email or chat. Here is a rule that warns when a disk is about to fill up:
groups:
  - name: disks
    rules:
      - alert: DiskAlmostFull
        expr: node_filesystem_avail_bytes{mountpoint="/"} / node_filesystem_size_bytes{mountpoint="/"} < 0.10
        for: 15m
        labels:
          severity: warning
        annotations:
          summary: "Less than 10% free space on {{ $labels.instance }}"
The for: 15m clause is an important teaching point: the alert only fires if the condition lasts fifteen minutes. Without it, a passing spike would wake the team for nothing, and a team disturbed too often ends up ignoring every alert.
2.4 Grafana to see
Grafana connects to Prometheus and displays metrics as dashboards. Ready-made dashboards exist for node_exporter; you then adapt them to the questions your team actually asks.
3. Back up: the only insurance against the unexpected
3.1 The 3-2-1 rule
The US Cybersecurity and Infrastructure Security Agency (CISA) sums up backup strategy in an easy rule:
- 3 copies of every important file: the original and two backups;
- on 2 different types of media, so they are not exposed to the same risk;
- with 1 copy off-site, safe from a local disaster (fire, flood, theft).
For an institution, a realistic version is: data on the server, a daily backup to a NAS in another building, and an encrypted copy off-site or in external storage, ideally immutable for a set period to withstand ransomware.
3.2 RAID, snapshots and backups are not the same thing
This is the most widespread confusion. RAID protects against a disk failure, not against accidental deletion: the deletion is instantly replicated on every disk. A snapshot lets you roll back quickly, but it lives on the same hardware as the data. Only an independent copy, on another medium and ideally another site, is a backup.
3.3 RPO and RTO: putting numbers on requirements
- The RPO (Recovery Point Objective) is how much data you accept to lose, expressed in time: a daily backup implies an RPO of 24 hours.
- The RTO (Recovery Time Objective) is the maximum acceptable time to restore service.
For an admissions platform during registration, a 24-hour RPO is unacceptable; for a brochure website, it often is. These two numbers, agreed with the people in charge, dictate backup frequency and architecture.
A backup that has never been restored is only a hypothesis. Schedule a restore test, at least once a quarter, on a test machine.
Common mistakes
- Believing the NAS’s RAID makes backups unnecessary.
- Keeping the only backup in the same room as the server.
- Setting alerts so sensitive that nobody reads them any more.
- Not monitoring the backups themselves: a job that has been failing silently for three months.
Key takeaway
Harden, monitor, back up, and check that you can restore. Self-hosting is safe when these four habits are routines, not projects.
References
- Prometheus, Alerting overview and Alerting rules.
- Grafana Labs, Monitoring a Linux host using Prometheus and node_exporter.
- CISA, Data Backup Options (PDF).
We would love to hear your experience
Did you make different choices? Run into other difficulties? Share your experience or your questions in the comments: we read and answer every message.
Leave a commentNeed a custom business application?
Admissions platforms, staff management, AI assistants, e-learning: we design, deploy and maintain applications tailored to your organisation.
Let's talk about your project

Comments
No comments yet: be the first to share your experience.